SAHS Gradebook Expectations
There are times in the life of every gradebook that someone besides the initial teacher needs to be able to explain and/or replicate the calculations that go into a grade and/or make changes when a final has been taken late. In order for this to happen in an efficient manner, teachers need to provide some intermediate information.
There are two basic ways for grades to be calculated: total points, and by category. Expectations are listed for each of these. Examples are also shown. Instructions are on the final page. Please let us know if your grading scheme does not fit either of these models.
Total Points
Individual
assignments:
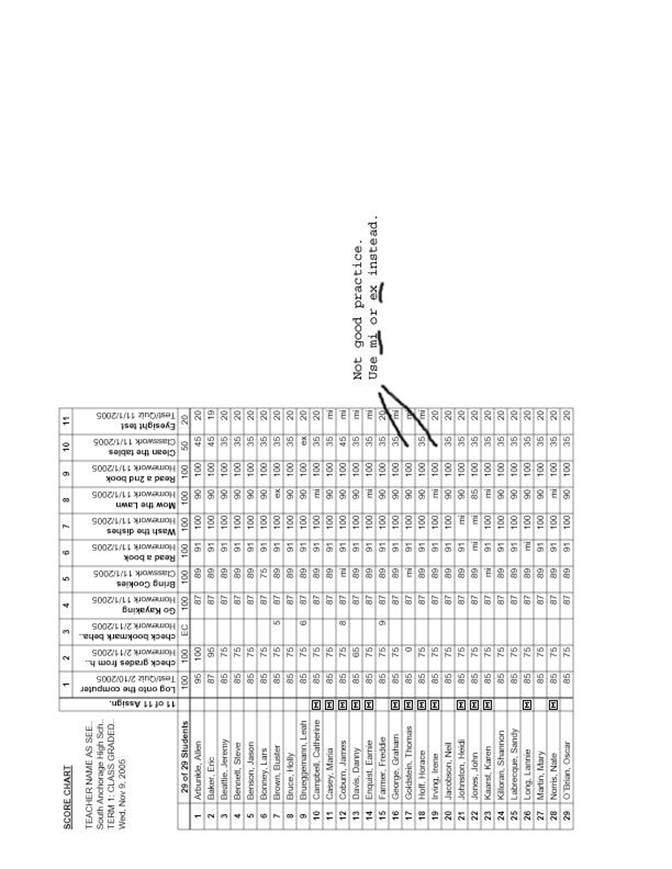
*The number of points earned for each student, the total number of points possible, and the date due should be shown. Assignments turned in late should be so indicated.
End of
Quarter:
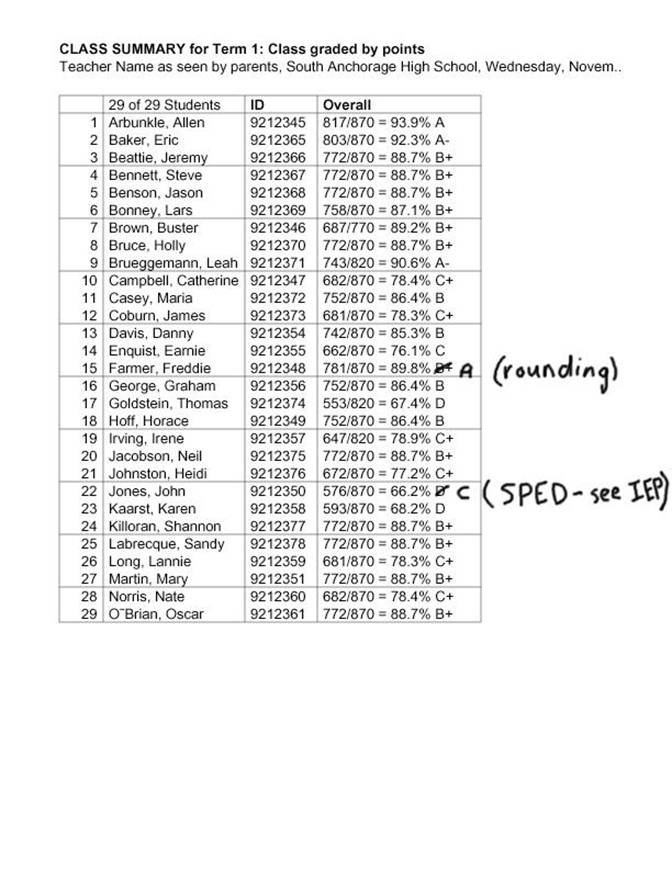
*The sum of the number of points earned and the number of points possible should be shown for each student.
*The quarter grade should be shown as the percentage and letter grade.
*The cut-off points for each of the letter grades should be listed.
*Any exceptions should be clearly noted.
By Category
Individual
assignments:
*The number of points earned for each student, the total number of points possible, the category, and the date due should be shown. Assignments turned in late should be so indicated.
End of
Quarter:
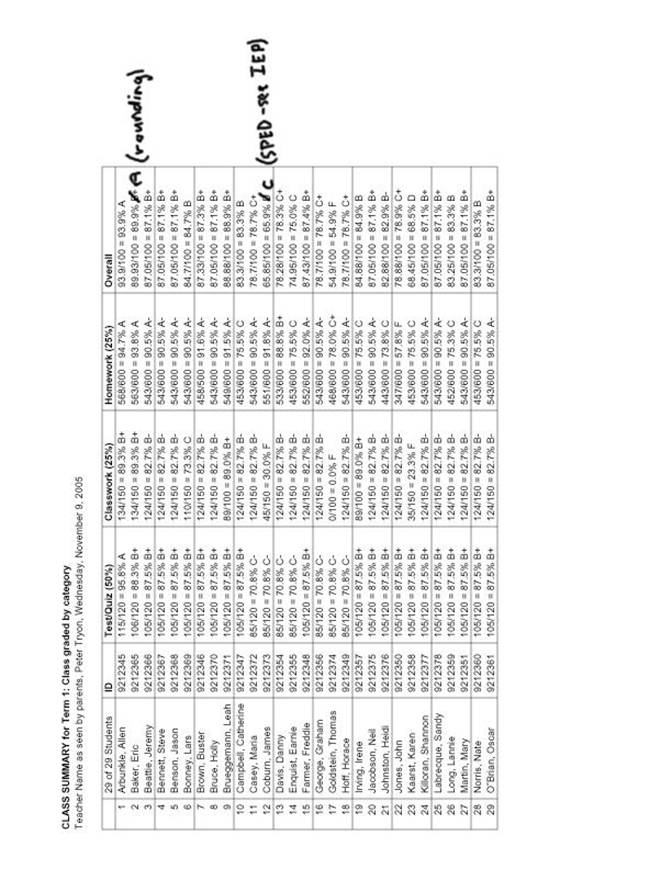
*The sum of the number of points earned and the number of points possible should be shown for each student and for each category. The weights of each category should be shown.
*The quarter grade should be shown as the percentage and letter grade.
*The cut-off points for each of the letter grades should be listed.
*Any exceptions should be clearly noted.
A summary page should show these grades for the quarter and for the semester for each class.
Plain Scores
By Points
Weighted Categories
Instructions
Instructions Common to each of the following sections
To create reports to print, start with selecting Print from the File menu.
Looking at the three tabs that show in the dialog box, the Student tab is for individual reports to be given to each student. The Chart tab is for ‘dense’ pages of data, primarily for the teacher to look at (or to serve as a hard-copy of the data). The Other tab provides special reports such as student passwords or special formatting.
By choosing All Current-term Classes, you can print out a page for each of your classes in one operation.
If you change to an appropriate font size, you should be able to limit the number of pages of paper you need to manage. I click on the Print Setup button and choose Landscape to fit more on. 8 pt Arial will fit 33 students in Landscape mode, 9 pt type will fit 27.
Nothing but scores
Basically, this is printing a Score Chart. From the File menu, select Print. Click on the Chart tab and select Score Chart. Choose All Current-Term Classes and choose a font size that works. Click on the Print Setup button to choose Landscape, Preview, and Print if satisfied.
Optional: To make a nice clean printout without the Summary grades in this part, you need to remove the columns from their position right after the names. I would do this, but I would do it to a copy of the gradebook so I did not have to put them back in again later.
1) Make a backup copy of your gradebook.
2) Working in your backup, click on the Column Header of one of the grade summary columns to the right of your student names. Select Delete THIS column. Repeat as necessary. Print scores according to the directions given above.
Summary (total points, no categories)
From the File menu, select Print and click on the Other tab from the choice of three.
Select Class Summary and click Next.
Make sure that all boxes are checked down the right side.
Click on the Set button next to Include Custom Column Options. Select only ID and Overall Grade.
Pick your font size, Landscape, Preview, as described in the first part.
Print.
Summary (split up by category)
This can be done whether weighting categories by specific percents or scoring by total points, but showing the grades in categories
From the File menu, select Print and click on the Other tab from the choice of three.
Select Class Summary and click Next.
In the Class Summary Report Options window, make sure that all boxes are checked down the right side.
Click on the Set button next to Include Custom Column Options, click Clear, and then click on ID, Category Grades and Overall Grade to select them. (If done in that order, they will show up in the same order on the printout.)
Pick your font size, Landscape, Preview, as described in the first part.
Print.